Fertility measures are an important aspect of understanding changes in population growth.
Taking a closer look at the recent and expected trends in Colorado’s fertility rates helps us to better
understand the population as it is today, and any changes we can expect to see in the future.
There are also many different lenses through which to view changes in fertility.
Changes by age, by race and ethnicity, and by regions within the state - each can give us a different
perspective and understanding of the changes we’re seeing.
But first… What is a fertility rate? In this series, we are talking about either the
General Fertility Rate (GFR) or the Total Fertility Rate (TFR). GFR is the number of live births per 1,000 females of
childbearing age (ages 15 to 44 years). A slightly different way of looking at fertility, the TFR is the number of children
that would be born to a woman if over her lifetime she experienced the current age specific birth rates for that geographic
area and period. A benchmark in fertility analysis is a total fertility rate of just over 2.1 or 2,100 births per 1,000 women
which, accounting for mortality, is called the “replacement level” total fertility rate.The information we’re looking at in
this series deals with GFR, unless otherwise noted.
Recent Trends in Colorado and the US
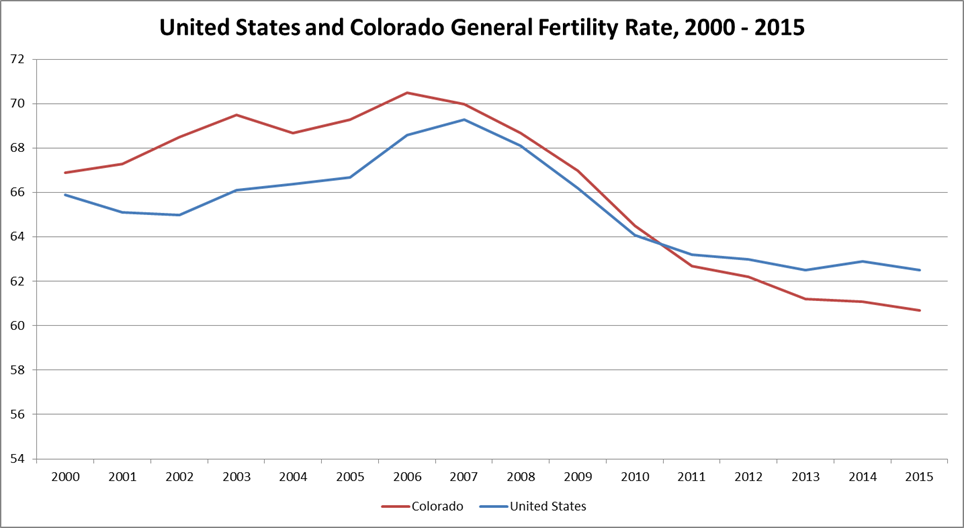
- Between 2000 and 2007, Colorado and the US experienced a steep decline in fertility,
both during and following the recession. Colorado’s decline was faster than the US as a whole,
leaving our state with a lower fertility rate after 2011, as shown in the chart below.
- According to the National Center for Health Statistics, the Western US led the declines in
fertility across the nation with Arizona, Utah, Nevada and California having the largest overall.
Colorado ranked 8th in terms of the decline in the GFR, dropping 14.6% between 2007 and 2015.
U.S. and Colorado General Fertility Rate 2000-2015

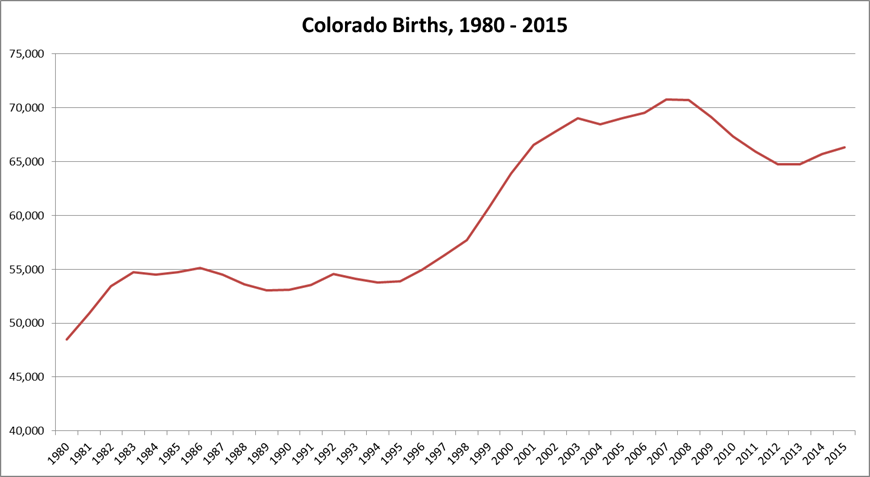
Although the fertility rate is still declining, it’s declining at a slower rate.
This more gradual decline, combined with an increasing population of females within childbearing
age has resulted in a slight increase of births in Colorado each year since 2014.
Colorado Births, 1980-2015

Changes in Fertility by Race and Ethnicity
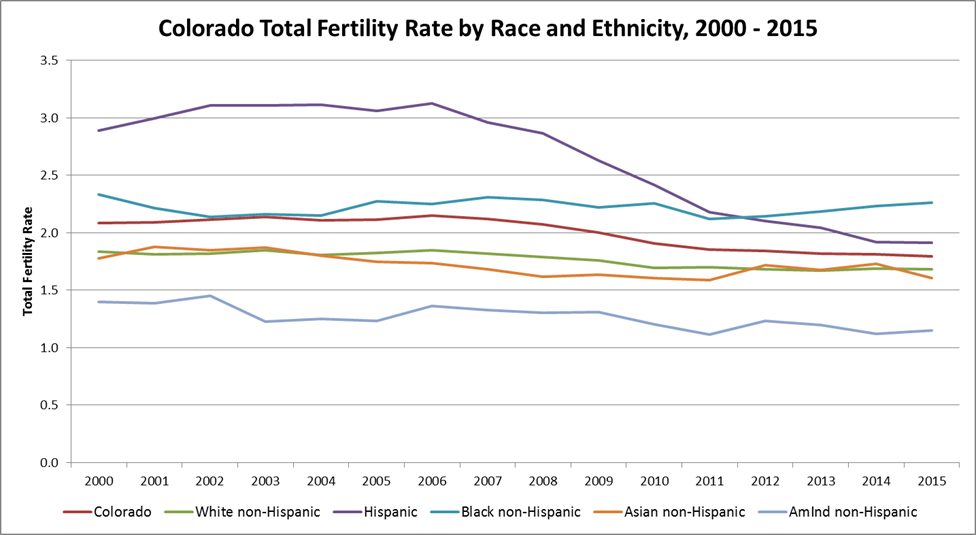
Colorado Births by Race and Ethnicity, 2000-2015

We’ve talked about how total fertility rates have fallen statewide, and it’s the same for all major race and ethnic groups as well.
As the chart below shows, in 2000, Hispanics had the highest total fertility rates. Rates have declined for all race and
ethnic groups in the state from just before the Great Recession to today.
Hispanic females have seen the largest decline, and there are two main reasons for this. A large share of their population is
within the younger age groups, and as we’ve already discovered, those age groups experienced the largest drop in rates. The second
reason is the declines in immigration that we’ve also seen in recent years.
Colorado Fertility by Region
- Within Colorado, fertility varies considerably between regions. The Eastern Plains, San Luis Valley,
Adams and Weld County are the only areas within Colorado currently experiencing above replacement fertility.
A large share of women of childbearing age in these areas are Hispanic, leading to more births, and historically
these areas of the state have consistently had higher fertility rates. This is likely due in part to the types of housing,
traditions and attractiveness of the areas to young families.
- With the exception of Weld County, all metropolitan counties and Rural Resort Region counties are currently at below
replacement total fertility rates. Boulder, the Rural Resort Region, Larimer, Jefferson and Denver have the lowest TFRs in the state.
Why? Well at least in part, the fact that Boulder, Denver, and the Resort Region all have the highest female labor force participation
rates in the state as well as some of the highest educational attainment levels for females certainly contributes to this trend.
- Outside of the Front Range, TFRs increased within the Eastern Plains, Northwestern Colorado, and Southeastern
Colorado, while it declined in Southern Colorado and the Southwestern Slope and resort areas of the Western Slope.
The largest increase in TFR in the state was in the Northeast region including Morgan, Logan, Phillips, Sedgwick,
Washington and Yuma counties.
Please contact the SDO team if you have any questions about the population of Colorado.


